
Ortosan. The Best Return in the Account Was Three Percent of the Budget.
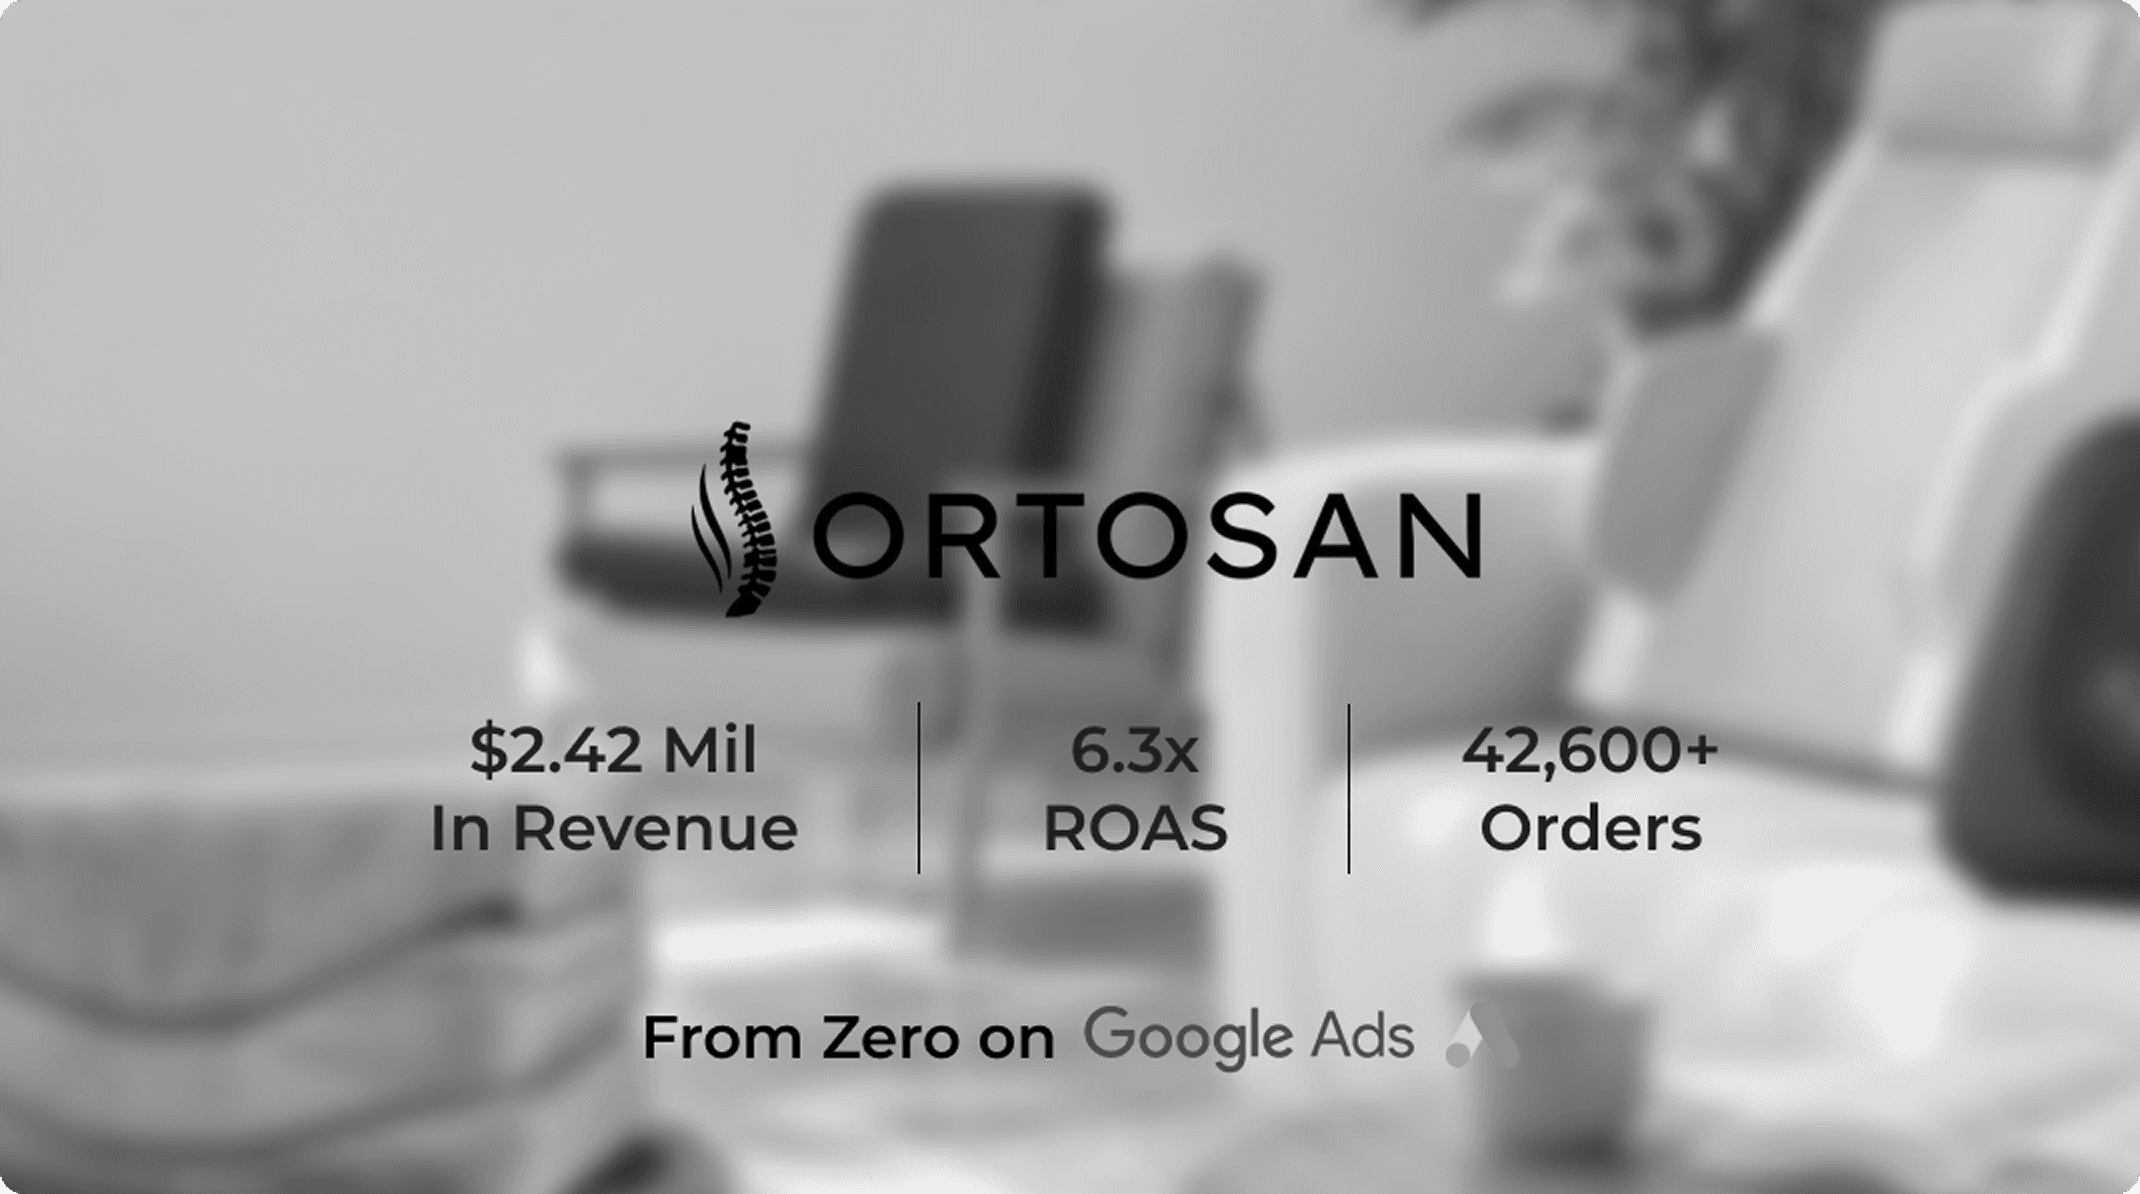
A Romanian orthopaedic brand running $636,000 through Google Ads over three years. I ran paid and email here inside the agency of record. Performance Max took 82% of spend while brand search returned fifteen times.
A Romanian orthopaedic brand running $636,000 through Google Ads over three years. I ran paid and email here inside the agency of record. Performance Max took 82% of spend while brand search returned fifteen times.
The Situation Before
3.8x
Blended ROAS
$16
Cost per Acquisition
$60
Average Order Value
Brand Budget Was Capped
Brand search returned 15.29 times on $20,208, the best money in the account. It was allocated 3.2% of budget and produced 8.2% of all tracked revenue.
Search Was Rank-Capped
Non-brand Search lost between 61.3% and 86.6% of eligible impressions to Ad Rank. The dynamic search campaign held just 16.8% impression share. The ceiling wasn't budget.
Display Never Worked
Display spent $1,298 and returned $1,602 across three years, at a $59 cost per order against a $10 account average. Demand Gen managed 4.25 on $6,650.
PMax Efficiency Flat
Performance Max returned 5.47 in 2024 and 5.47 in 2026. Eighty-two percent of budget sat in a channel that had not improved its unit economics in three years.
Brand Budget Was Capped
Brand search returned 15.29 times on $20,208, the best money in the account. It was allocated 3.2% of budget and produced 8.2% of all tracked revenue.
Display Never Worked
Display spent $1,298 and returned $1,602 across three years, at a $59 cost per order against a $10 account average. Demand Gen managed 4.25 on $6,650.
Search Was Rank-Capped
Non-brand Search lost between 61.3% and 86.6% of eligible impressions to Ad Rank. The dynamic search campaign held just 16.8% impression share. The ceiling wasn't budget.
PMax Efficiency Flat
Performance Max returned 5.47 in 2024 and 5.47 in 2026. Eighty-two percent of budget sat in a channel that had not improved its unit economics in three years.
The Diagnostic
Before writing a single ad or building a single flow, we ran a full revenue leak audit across the ad account, email platform, and funnel.

Brand Underfunded
The highest-returning line in the account was capped at three percent of spend for three straight years.
Brand Underfunded
The highest-returning line in the account was capped at three percent of spend for three straight years.

Revenue Process
We've Built
The exact systems we put in place across ads, funnel, and email to fix the leaks.
Brand Defence Layer
Built a dedicated brand protection campaign on exact and phrase match. It returned $308,993 on $20,208 at 15.29 times, with a $4.40 cost per order across three years.
PMax Consolidation
Consolidated volume into product-line Performance Max campaigns carrying 82% of spend at 5.74 return, delivering 50,082 of the account's 63,194 total orders.
Search Category Split
Split dynamic search into category ad groups rather than one catch-all. Search became the highest-returning channel in the account at 7.25 on $85,118 of spend.
The Build
We've Built
The exact systems we put in place across ads, funnel, and email to fix the leaks.
Brand Defence Layer
Built a dedicated brand protection campaign on exact and phrase match. It returned $308,993 on $20,208 at 15.29 times, with a $4.40 cost per order across three years.
PMax Consolidation
Consolidated volume into product-line Performance Max campaigns carrying 82% of spend at 5.74 return, delivering 50,082 of the account's 63,194 total orders.
Search Category Split
Split dynamic search into category ad groups rather than one catch-all. Search became the highest-returning channel in the account at 7.25 on $85,118 of spend.
What Didn't Work
A Search campaign spent $720 serving ads across twenty-one Brazilian states on Portuguese tax queries. It ran on “pgmei” and “das mei” — terms for a Brazilian small-business tax filing — took 200 clicks and converted nothing at all. Nobody caught it for months because the spend was small enough to disappear inside a seven-figure account.
We kept Display and Demand Gen alive for three years on the theory they would eventually find an audience. Between them they spent $7,948 and returned $29,868, at a 3.76 blended figure against 5.95 across the core channels. Display was the worse of the two at 1.23, with a $59 cost per order against $10 elsewhere. Both should have been cut in year one.
A Search campaign spent $720 serving ads across twenty-one Brazilian states on Portuguese tax queries. It ran on “pgmei” and “das mei” — terms for a Brazilian small-business tax filing — took 200 clicks and converted nothing at all. Nobody caught it for months because the spend was small enough to disappear inside a seven-figure account.
We kept Display and Demand Gen alive for three years on the theory they would eventually find an audience. Between them they spent $7,948 and returned $29,868, at a 3.76 blended figure against 5.95 across the core channels. Display was the worse of the two at 1.23, with a $59 cost per order against $10 elsewhere. Both should have been cut in year one.
The Results
6.0x
Blended ROAS
$10
Cost per Acquisition
$60
Average Order Value
Brand Returned Fifteen Times
Brand search returned $308,993 on $20,208 at 15.29, with a $4.40 cost per order across three years.
Search Beat Every Channel
Search returned $617,514 on $85,118 at 7.25, the highest-returning channel in the account at meaningful scale.
63,194 Orders Delivered
The account produced 63,194 orders across 1,097 days, at a $10 blended cost and a $60 average order.
Three Years, 5.93 Blended
$3,769,124 returned on $636,126 of managed spend, held above 5.7 in every full year of the engagement.
Brand Returned Fifteen Times
Brand search returned $308,993 on $20,208 at 15.29, with a $4.40 cost per order across three years.
63,194 Orders Delivered
The account produced 63,194 orders across 1,097 days, at a $10 blended cost and a $60 average order.
Search Beat Every Channel
Search returned $617,514 on $85,118 at 7.25, the highest-returning channel in the account at meaningful scale.
Three Years, 5.93 Blended
$3,769,124 returned on $636,126 of managed spend, held above 5.7 in every full year of the engagement.